


Probability of getting x yes answers out of y independent Bernoulli trials
Binomial distribution
How many trials are needed before getting an answer of a certain type?
Geometric distribution
Probability of number of events in a certain amount of time (random arrivals)
Poisson distribution
Probability distribution of time between events in a Poisson process
Exponential
Continuous probability distribution; the time to failure
Weibull
Name two important reasons for removing factors from a model.
Overfitting and Simplicity
Name 3 types of factor based models
Classification
Clustering
Regression
You can only apply variable selection on Regression models (True or False)
False. Variable selection can apply to factor based models.
When the number of factors is close to number of data points or when we have more factors than data points, this is know as:
Overfitting
When the number of factors is close to or larger than the number of data points, the model fits too closely to real or random effects?
Random! If we have too many factors, the model might fit too closely to random effects.
Why would we want to build a simple model over a complex model?
1) Less data is required and data can be hard and expensive to collect
2) Less chance of including an insignificant factor
3) Explaining a complicated model can be difficult so smaller models are easier to interpret
Most people will take an r-squared value as sufficient evidence of a good model, True or False
False! What is it really saying qualitatively about the relationships between factors? You need to be able to explain the model.
Which is the better model? One with 100 factors or one with 1000 factors with approximately the same effectiveness.
Choose the smaller model!
Some factors are illegal to use for credit decisions! Name some
Race
Sex
Religion
Marital status
True or False. Just because you can't use some factors such as race for your model, you can use a correlated field such as zip code instead.
False! Can not use highly correlated factors to forbidden factors
Start with a model that has no factors. At each step, find the best new factor to add to the model and put it in...as long as there is good enough improvement. When there's no factor good enough to add or we have enough we stop. At the end, can optionally remove or add factors. This type of variable selection is known as:
Forward Selection.
In a forward selection model, you decide the definition of good and good enough. Factors with a p-value less than .1 or .15. Once added, the factors can not be removed. True or False?
False. If p-value is below .1 or .15 for exploration, but at the end when removing factors, you can remove anything with a p-value above .05
Start with a model that includes all factors and at each step, find the worst factor and remove it from the model. Continue until there's no factor bad enough to remove and the model doesn't have any more factors you want.
Backward Elimination
Combination of forward and backward elimination.
Stepwise Regression
There is more than 1 variant of stepwise regression (True or False)
True. You can start with all factors or no factors and at each step, remove or add a factor.
In variable selection, when you build up a model from nothing it is called : Forward, Backward, Stepwise with a forward approach, Stepwise with a backward approach?
Forward and Stepwise with a forward approach
What type of variable selection allows you to adjust by eliminating a factor right away that no longer appears to be good enough.
Stepwise Regression
Using p-values is the only way to determine whether or not to add or remove a factor from a model?
False. Other metrics like r-squared, Akaike information criterion, and Bayesian information criterion can be used to pick a factor or remove it.
What type of methods can be used to determine whether or not a factor is added or removed from a model using Forward, Backward, or Stepwise regression?
p-values
r-squared values
Akaike information criterion
Bayesian information criterion
A Greedy Algorithm does not take into consideration future options. At each step, it does the one thing that looks best. Which type of variable selection method is greedy?
Forward selection
Backward elimination
Stepwise regression
Type of variable selection. Add a constraint and essentially give a budget, called t (tao) to use on coefficients. The least important factors get zero coefficients and are removed from the model.
LASSO approach
True or False. Whenever constraining the sum of coefficients, we first need to scale the data (SVM or regression) otherwise, the units will artificially affect how big the coefficients need to be.
True. Scale the coefficients when using the Lasso approach for variable selection.
Type of Variable selection where you want to select coefficients to minimize the sum of squared errors but add in the restriction that the sum of the coefficients can't be too large.
Elastic Net
Picking the right value of t (tao) in Lasso depends on two things:
Number of variables you want
and
Quality of the model as you allow more variables
Method of variable selection where a combination of absolute value of the coefficients and their squares are constrained.
Elastic Net
Scaling the data is important for stepwise regression, elastic net, and lasso variable selection approaches.
False. Scaling the data is important for both Lasso and Elastic Net. If the data is not scaled, the coefficients can have artificially different orders of magnitude which means they'll have unbalanced effects
True or False. The same issues, needing to first scale the data and picking the right value of t apply for elastic net just like for lasso
True
When you take out the absolute value term from Elastic Net, you get
Ridge Regression
Newer methods based on optimization models which make decisions globally to do variable selection are:
Lasso and Elastic Net
True or False. Ridge Regression is a variable selection approach that leads to better predictive models.
False. Ridge Regression does not do variable selection. It does sometimes lead to better predictive models.
Which method of variable selection is quicker to compute but might have more random effects and appears to have a higher r squared value than if tested on different data?
Classic older models - like Stepwise regression
True or False. LASSO and Elastic net are slower to compute but give better predictive models.
True
What looks like LASSO regression plus Ridge Regression?
Elastic Net
The quadratic term shrinks the coefficient values - the quadratic constraint pushes them toward zero and regularizes them but doesn't make them zero. It reduces variance.
Ridge Regression
Prediction Error is a function of both ___ and ___. Trading off bias for variance can lead to better predictive models.
Bias and Variance
________ approach has the benefit it can combine variable selection benefits of Lasso with predictive benefits of Ridge Regression
Elastic Net
Disadvantages of Elastic Net are
* Arbitrarily rules out some correlated variables like LASSO
* Underestimates coefficients of very predictive variables like Ridge Regression
Which variable selection method is the best to use?
Try to look at multiple approaches and compare the differences. Human input is always beneficial
When two predictors are highly correlated, ridge regression will usually have non-zero coefficients for both predictors. Ridge regression will choose small non-zero coefficients for both models. It may underestimate the effect of the factors
Design a way to collect best subset of data quickly and efficiently. The data must be sufficient to answer the questions we need it to. This design process is called
Design of Experiments or DOE
1) Determining which ad to use that will get the most clicks
2) showing similar products on a website
3) Showing complementary products
4) Survey or political poll and making sure to get a representative sample
5) Comparing combinations of medical treatments
6) maximizing agricultural productivity
All examples of using the DOE method
Two important concepts when using design of experiments (DOE) are 1) Comparison and Control 2) _________
Comparison; Control
Blocking
When using DOE, making sure data points collectively are about the same in all important features.
Control for other factors
A ______ is something that could create variation and can account for some of the difference between factors. If we can account for the difference we can reduce the variability in our estimates.
Block factor. Ex. The type of car, sports or family is a blocking factor that can account for differences between red and blue cars. We'll have lower variance if we split sports and family cars
If we're testing to see whether red cars sell for higher prices than blue cars we need to account for the type and age of the cars in our data set. This is called: a) controlling b) comparing or c) combining
Controlling. We need to control the effects of type and age.
A simple way to compare two different alternatives. For example, to see which of two different banner ads generates more clicks.
A/B Testing
In A/B testing, we would collect data and in the end have essentially binomial data. A ______ test can be used to show which is more effective.
Simple hypothesis test
A/B testing can be used as long as:
1) Collect a lot of data quickly
2) Data comes from a representative sample of the whole population
3) Amount of data collected is small compared to the total population
When there are multiple factors, how do you test the effectiveness of every combination?
Full Factorial Design
Basic ______ analysis of variants can determine how much of each of the factors contributes to the differences in each combination.
ANOVA
Subset of combinations to test is called a ________ design. The basic idea is to test fewer combinations while still testing a good range of values for each factor.
Fractional Factorial
Test each choice in a fractional factorial design the same # of times. Test each pair of choices the same # of times.
Balanced Design
If we believe factors are _______ we can test a subset of combinations and use _____ to estimate the effect of each choice.
Independent
Regression
Response Surface Methodology is similar to _____ but it allows for squared terms as well as linear terms when running the tests.
Factorial Design
Factorial Design
- Use before collecting data
- Determine effects of factors
- Full factorial design (Test all combinations)
-Partial Factorial Design (Estimate all effects by comparing some combinations)
_______ helps us find the impact of each different factor in combination with others
Factorial Design
Determine the better of two alternatives
A/B testing
When performing a test to see which is best, you might be losing value. There is a tradeoff. Balance the benefits of getting more information and getting immediate value.
Focusing on getting more information to determine something with more certainty
Exploration
Focusing on getting immediate value
Exploitation
Approach to DOE
K alternatives
No information
Equal prob of selecting each alternative
Repeat
Choose an alternative to test based on prob of each being best
after test, update prob of each one being best
Repeat until best alternative is clear
Multi-Armed Bandit
With _______ Keep testing multiple alternatives - so still doing ________ but we make it more likely to pick the best ones so we're also doing _______. We keep repeating process of collecting data, updating probabilities until we're sure which one is best. We getting more value out of the process by making it more likely to pick the options with higher estimated value.
Multi-Armed Bandits
Exploration
Exploitation
What are three parameters which can be varied in the multi-armed bandit algorithm?
1) Number of tests between recalculating probabilities
2) How to update the probabilities
3) How to pick an alternative to test based on prob and/or expected values
Which algorithm usually works better than running a fixed, large number of tests for every alterative? Help you learn faster on the fly and create more value along the way?
Multi-Armed Bandit
Multi-armed bandit models use the best answer (exploitation) the more they're sure it's best. If the model is less sure what's best, it's more likely to concentrate on trying many options (exploration)
Sometimes simply matching data to a probability distribution can give valuable insight based on how the probability distribution is derived. That's especially true when the only information we have about a data point is the ________ or when it's _______ to collect and analyze additional information.
response
hard
Arrivals to security lines at an airport, Broken equipment in a manufacturing facility, website viewers who buy products they've clicked on can use this simple type of model
Probability distributions
Probability distribution like flipping a coin
Bernoulli Distribution
Count of successful flips in n trials
Binomial Distribution
Unsuccessful flips before first success
Geometric Distribution
Special category of binomial random variable. Have exactly one trial. Define success as 1 and failure as 0.
Bernoulli Random Variable
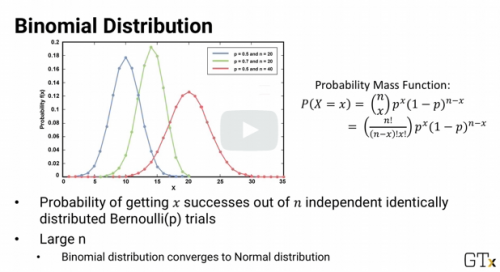
The probability of getting x yes answers out of n independent bernoulli trials, each with probability p is called
Binomial Distribution
The probability of a Bernoulli Distribution should be 50/50 (True or False)
False. It might not be 50/50
A binomial random variable can only take on two values True or False?
True.
Binomial Random Variables
Each trial must be independent
Each trial can be called a success or failure
There are a fixed number of trials
Probability of success of each trial is constant (but do not have to be equally probable)
Example. Charity asks for donations 1/12 of their mailing list each month
Each person P (sends donation) = p
P (does not send donation) = 1 - p
Donations are same size
p does not change
**Number of donations each month is binomially distributed
In binomial distribution, as n gets very large, the binomial distribution converges to the ___________ distribution
Normal
Type of Distribution? How many interviews until the first job offer?
Geometric Distribution
Type of Distribution when we want to know how many trials are needed before we get an answer of a certain type?
Geometric Distribution
How many hits until a baseball bat breaks?
Geometric Distribution
How many good units manufactured before a defective one?
Geometric Distribution
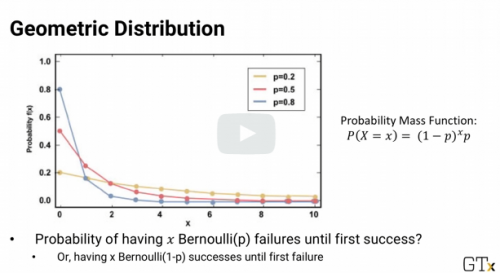
How many trials we have until we get a certain success. We run an infinite number of trials until we get a success. Each trial must be independent, each trial is a success or failure, and the probability of success of each trial is constant.
Geometric Random Variable
Flipping a coin until we get heads is what kind of distribution
Geometric distribution
In geometric distribution, p is the probability of getting the answer you're looking for in the end. p can be the prob of a good outcome or it can be the prob of something bad. True or False.
True. Be careful how p and 1-p are defined. Understand the meaning behind the formula.
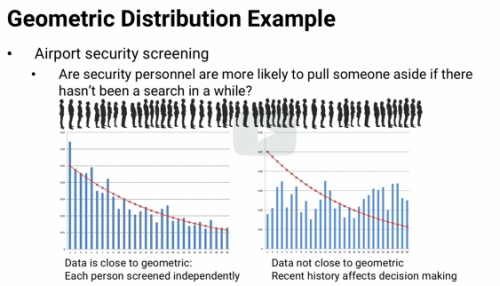
If distribution fits geometric distribution, then they could be independent and identically distributed - but if not, then you might have to look deeper and consider other factors.
_________ distributions are finding the probability that a specific number of events will occur over a given period of time or distance or area or any other kind of measurement.
Poisson Distribution
Type of distribution - finding the number of customers that will walk into your store over the course of the next hour or day.
Poisson
Number of sandwiches that a shop will sell over the next hour
Poisson
Number of ripe pieces of fruit a farmer will find in the next square mile of his farm
Poisson
Number of umbrellas you'll see as you walk the next mile on your trip to work
Poisson
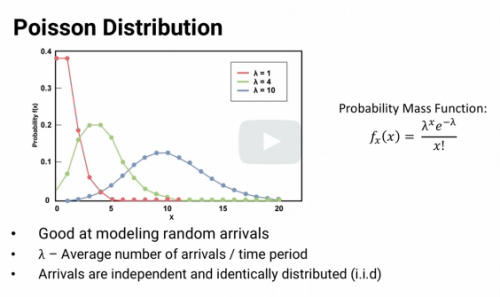
Good at modeling random arrivals
Lambda - average number of arrivals / time period
Arrivals are independent and identically distributed
What type of distribution is complimentary to Poisson?
Exponential Distribution
If arrivals are Poisson, with arrival rate lambda, the time between arrivals - the inter arrival time follows the Exponential distribution with 1/lambda as the average inter arrival time
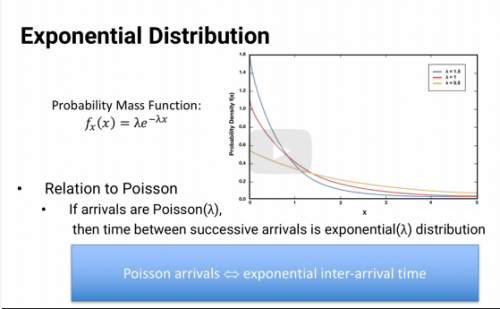
True or False. If times between arrivals are exponentially distributed with average inter-arrival time 1/lambda, then the arrivals follow the Poisson distribution with an average of lambda arrivals per unit time.
The _______ distribution is useful for modeling the amount of time it takes something to fail, specifically the time between failures.
Weibull Distribution
What tracks how much time there is between failures?
Weibull Distribution
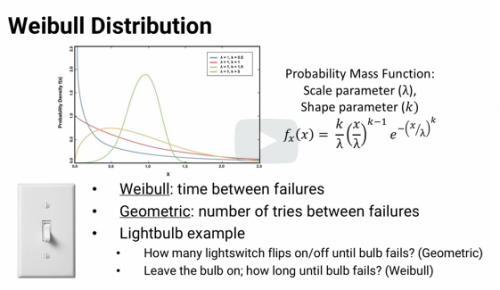
How many times you can flip your light switch on and off before the switch breaks
Geometric Distribution
If you want to keep the light on all the time, and wondering how long the bulb will last before it blows
Weibull
Weibull Distribution : When K < 1
Modeling when failure rate _________ with time.
Worst things fail ________ (parts with defects)
Decreases
First
Weibull Distribution: When K > 1
Modeling when failure rate ________ with time
Things that wear out (Ex. tires)
Increases
k = 1
Modeling when the failure rate is _______ with time
Constant
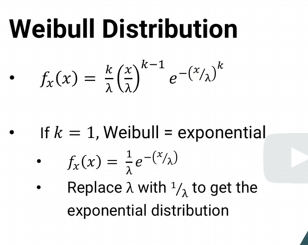
Weibull Distribution. When k is exactly equal to 1, it reduces to the _______ distribution. (substitute lambda for 1/lamda) - Essentially the same expression
Exponential.
Whether its a failure rate that's constant over time or an inter arrival rate thats constant over time, the two distributions give the same results.
Software can take a data set and determine its fit to a probability distribution and tell you best fit parameters. Should you always follow what the software suggests?
No. Only use software output as guidance! Data might have random noise in it!
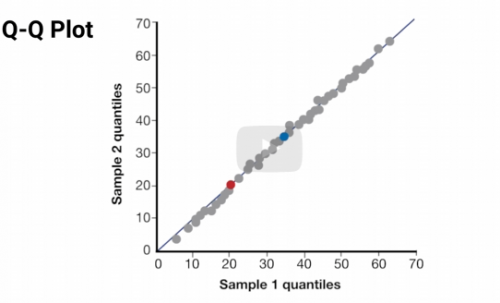
Use a ___ ___ Plot to visualize whether two distributions are about the same.
Q-Q
You can visualize whether a data set is distributed similarly to a probability distribution using a Q-Q Plot. True or False
True
Two similar distributions should have the same values at each quantile. True or False?
True. Should be true for all quantiles
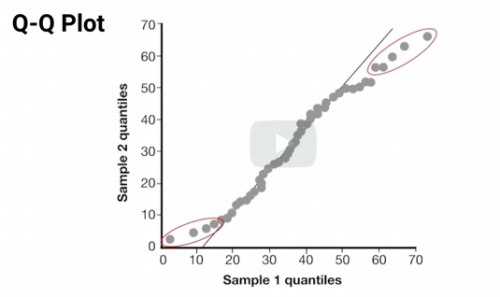
This is a good match - showing data falling along a 45 degree line
Looking at the plot, lets us qualitatively understand what's going on. The 2nd ex shows the statistical test is not a good match. Lower and upper tails have higher values.
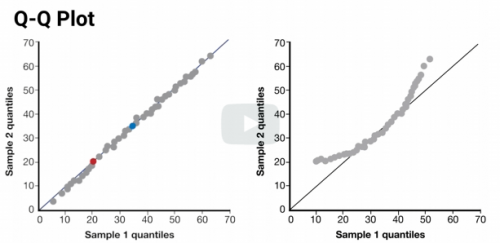
A statistical test might say this is a good match - the QQ plot shows the differences at the high and low ends. If the point is to study extreme values, they're not a good match
Use Q-Q Plots to test whether a single data set is a good fit to a probability distribution. We can use the dataset for the horizontal axis and theoretical values of percentiles for the Vertical axis.
In a Queuing example, the arrival distribution is Poisson with parameter lambda. The length of time is exponential with parameter mu.
If something fits a probability distribution we can model it's behavior. Like a queueing system. Based on the number of calls in the queue we can determine how many employees are needed.
In Queuing Example, calls arrive with Poisson and parameter , lambda, and the length of the call is exponential with parameter mu. With one employee, we can calculate the time our employee is busy, the expected wait time, and the expected number of calls in the queue.
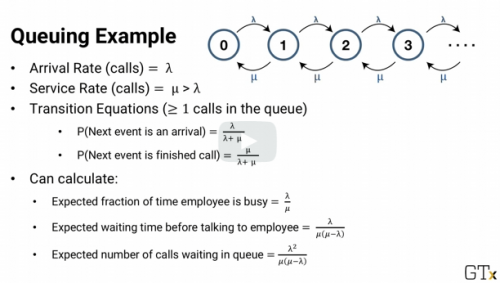
In more complex queuing system, we can come up with closed form answers because of the memoryless property of Poisson and exponential probability distributions.
Memoryless probability means it doesn't matter what's happened in the past, all that matters is where we are now.
True of False. In a queuing system with exponential distribution, how long an employee has been on the phone matters and is used to determine wait time.
False. It doesn't matter. The distribution of the remaining call time is exactly the same. It's purely a property of the exponential distribution. It's not something we need to know beforehand. It's something we can discover by finding the call time distribution.
If a tire wears out, should a manufacturer pay damages? Tires are more likely to fail the more worn out they are. This is not memoryless. Which probability distribution can be used?
Weibull with K > 1
Note Kendall notation is a standard notation in queuing models
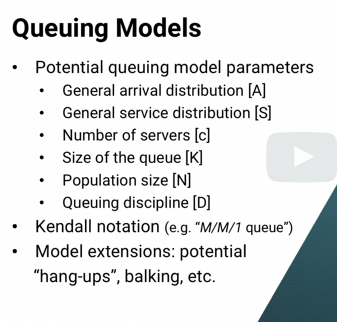
A person might think there are too many people and think they have to wait too long and will leave without buying anything. This is called _________
Balking
We build a model of something to study and analyze it's behavior ( Manufacturing, Airport Security lines, Freight train dispatching). This is called _________
Simulation
_________ Simulations never vary, given the same inputs, the outputs will always be the same. There is no randomness in the system.
Deterministic simulation
In _______ Simulations, you might get a different output each time the model is ran because the system includes some randomness that we modeled. Generally more useful in analytics.
Stochastic simulation
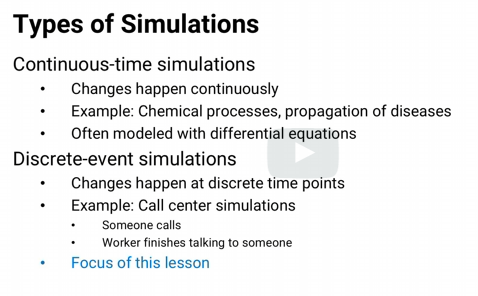
Discrete Event Stochastic Simulations are very valuable in Prescriptive analytics for analyzing systems that have a lot of randomness or variability. Average values are not good enough. Used in modeling a machine in a manufacturing process.
Simulation Software can be used to determine how many baggage tugs needed and where to be located, right mix of workers in a dr office, rescheduling airline flights due to a storm...
Simulation software allows you to build models using several types of elements.
Elements of a Simulation Model:
Entities - things that move through the system( bags, people)
Modules - parts of the process (queues, storage)
Actions
Resources (workers)
Decision points
Statistical tracking
A key in Simulations is Replication. Run multiple times to get distribution of outcomes. Plot the distribution, find the average throughput, and use in final analysis
Optimization is a key underlying part of descriptive and predictive analytics.
Optimization is also very important for prescriptive analytics.
The type of analytics that asks, given what I know and what I predict, what is the best course of action to take?
Prescriptive Analytics
Examples of Optimization for Prescriptive Analytics:
*airplane mechanic scheduling
*Crude oil shipment planning
*Server Farm allocation
*Machine shop production
*GPS routing for cars
*Army recruiting asset usage
*Professional sports draft priority determination
*Worldwide oil delivery and routing scheduling
*Electricity generation accounting for weather impact on atmospheric effects
Optimization can be a very powerful tool in analytics sitting on top of descriptive and predictive analytics. This is also known as __________
Prescriptive Analytics
Optimization also directs your organization at strategic, operational, and tactical levels
True or False. Optimization software is good at building models for you.
False. Optimization software can solve optimization models but there isn't yet good software to build the models for you.
True or False. Statistical software can both build and solve regression models. Optimization software only solves models; human experts are required to build optimization models.
True.
True or False. Optimization is a key piece of other analytics models.
True. It's also a powerful tool for answering prescriptive analytics questions.
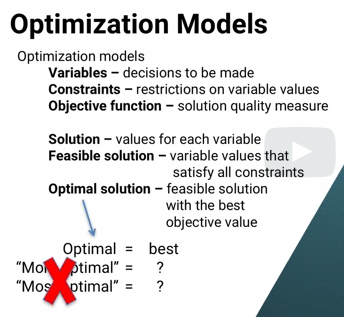
Three Main components in Optimization Models are:
Variables
Constraints
Objective Function
The ______ in a model are decisions that the optimization solver will pick the best value for.
Variables.
Optimization Models: Decisions to be made are:
ex. Zi = 1 if state i is ever visited, 0 if not
Xi = total time spent in state i
Variables
Some examples of variables in an Optimization Model
xi = total time spent in state i
yi = number of visits to state i
zi = 1 if state i is ever visited, 0 if not
wid = time spent in state i on day d
vid = 1 if state i visited on day d, 0 if not
Optimization: ______ in a model are restrictions on those decisions that we make, restrictions on values of the variables.
Constraints
Which of these are constraints?
a) Vid = 1 if state i visited on day d, 0 if not
b) A candidate visits Florida at least 3 times in the last week, days 24 - 30
c) The candidate can't spend more than 30 total days on all states
d) zi = 1 if state i is ever visited, 0 if not
B and C. A and D are variables
In optimization, what is this?
The candidate visits Florida
at least 3 times in the last week, days 24 through 30.
In other words, the sum over days d equals 24 through 30 of v
Florida d must be greater than or equal to 3.
Constraint
Link our variables together correctly.
vid is the number of visits to state i on day d, and yi is the total number of visits to state i.
So we need to make sure that when we sum up vid over all days d, the total equals yi.
This is called a
Constraint
True or False. Optimization solvers only look at the math. They don't look at the words of what we want the variables to mean. So if we don't use constraints to explicitly tell the solver how variables should be related, The solver will go happily ahead and find a mathematical solution,
telling our candidate to visit state i 12 times, but that each vid should be 0.
True
In optimization models, the constraints must add up. Software does math but does not understand reality.
In optimization models, the _______ function is a measure of the quality of a solution, the quality of a set of values for the variables we're trying to maximize or minimize.
Objective
_________ might measure how many additional votes we could expect the candidate to get based on the campaign schedule. Perhaps, alpha times the population of state i times the square root of time spent in state i plus a third times however long is spent in neighboring states. Plus beta times the number of times each state is visited each day, times the factor for the day, maybe visiting too early or too late dilutes the effect
Objective Function
True or False. Sometimes optimization requires input from other statistical models
True. In order to use the optimization model, we first need to use statistical methods,
like regression, to find the right values of alpha and beta, to determine the relationship between time and votes, etc.
In fact, it's pretty common for optimization models to require input that's found as the output from other models.
In optimization, a solution is a value for each variable. For ex. Amount of time spent in each state.
variable
In optimization, a solution that satisfies all of the models constraints is called the
Feasible Solution
The Feasible Solution that has the best objective function value is called the
Optimal Solution
Decisions that the optimization model will find the best value for
Variables
Restrictions on the decisions that can be made in an optimization model
Constraints
Measure the quality of a solution in an optimization model
Objective Function
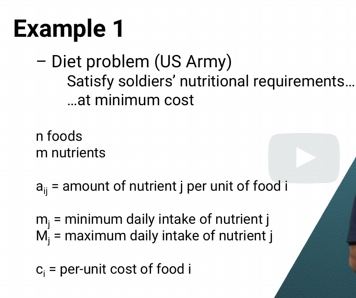
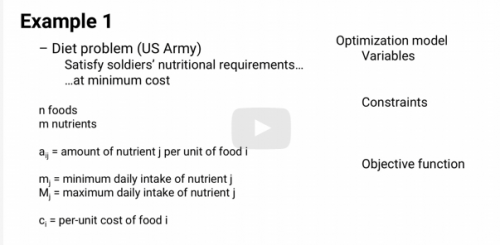
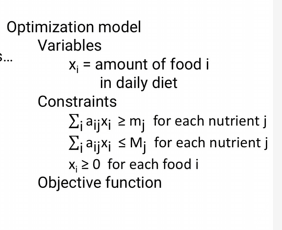
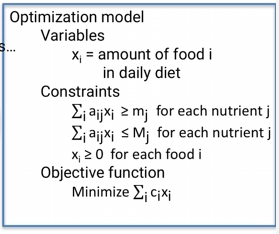
Optimization Model - Diet Example
Variables: Xi = amount of food i in daily diet
Constraints: The sum over all i of aij times xi has to be greater than or equal to lower case mj.And the sum over i of aijxi has to be less than or equal to upper case Mj.
They require that the daily intake of nutrient j is between the lower and
upper limit.
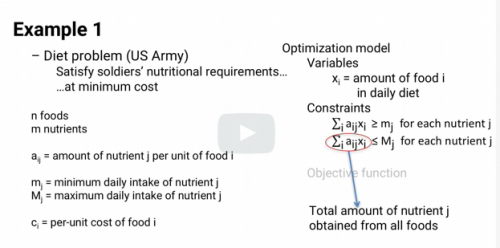
Another constraint that's so obvious, it's often overlooked. All the xi must be greater than or equal to 0. It's impossible to each negative amounts of food.
Remember that the army wants to minimize the cost of the daily diet. Here's the objective function, the sum over i of cixi. For each food i, we multiply the per unit costs ci by the units of the food eaten or xi to find the money spent on that food each day. Adding up over all foods gives the total cost of the diet. And that, the variable definitions plus the constraints plus the object function,
is the optimization model they used.
writing the contractual constraints.
Given variables xi, that are the number of workers on day i, how can we write constraints to ensure that the company meets the union
requirement of each worker working 5 days in a row and getting the other 2 days off?
It turns out to be hard, and the reason is that we chose the wrong set of variables.
Instead, we should've chosen variables like these.
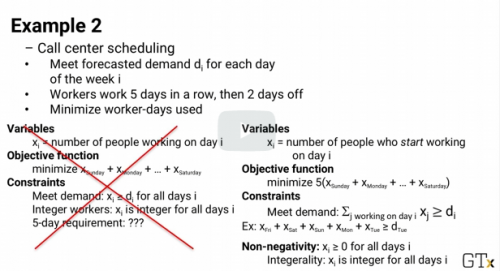
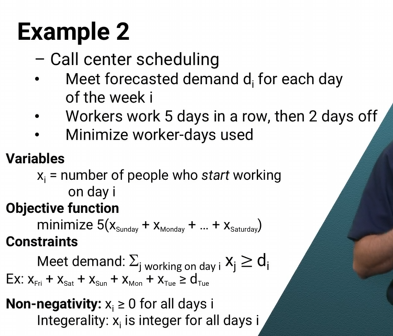
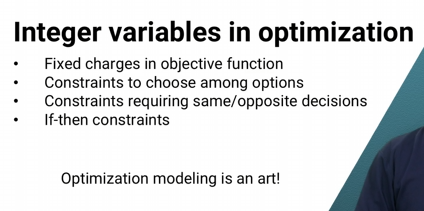
________ Variables allow more-complex optimization models.
Binary
Data Problems
Missing data
Wrong data
- Often patterns in missing or wrong data
Patterns in Missing data. (Some are more likely to be missing)
Transplanted Livers
Income
Radar gun more reliable on measuring speed
Bias in missing data
Which of these is a common reason that data sets are missing values?
1) A person accidentally typed in the wrong value
2) A person did not want to reveal the true value
3) An automated system did not work correctly to record the value
4) All of the above
All are common reasons why data might be missing
A difficult issue is when values of one type are more likely to be missing than others. There's a bias in the values of the data that are missing and we deal with it differently
What are common reasons data sets are missing values?
1) A person accidentally typed the wrong value
2) A person did not want to reveal the true value
3) An automated system did not work correctly to record the value
4) All of the above
These are common reasons why data might be missing
Dealing with Missing Data
* Throw Away
* Use categorical variables to indicate missing data
* Estimate the missing values
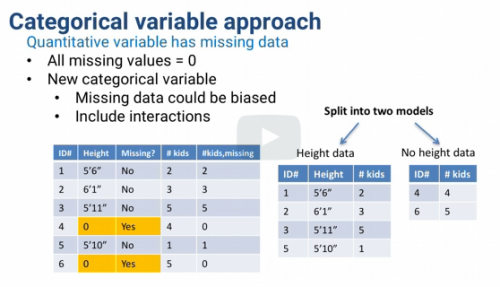
Categorical variable approach for missing data
1) Add category: missing
2) If quantitative, all missing values = 0
3) Add a Missing? column
Two different ways of dealing with missing data and avoid estimating what missing data might be:
1) Remove
2) Add categorical variables
In general, when a data point has missing data there are three things
1) Throw the data point away entirely
2) Use categorical variables to indicate missing data
3) Estimate missing data, imputing data
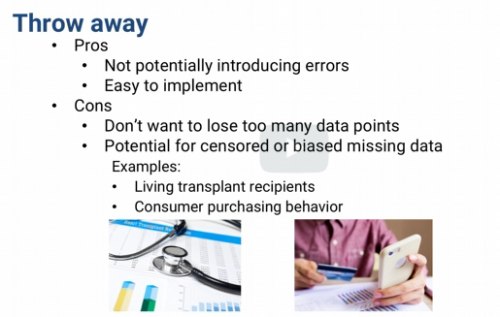
Advantage of throwing away data points has advantage of not potentially introducing errors if our estimates of missing data are way off. Easy solution to implement (cont)
Drawbacks - If there are a lot of data points missing data, we might not want to shrink our data set too much. We also have to consider potential for censored or biased missing data
True of False. It's important to check the patterns of missing data to make sure we're not making a mistake if we throw them out.
True.
A common approach is also to include interaction variables between the categorical variable and other variables. Another way of looking at this is that we're doubling those other variables, and now we'll have two versions of them.
For example, height when income is missing and height when income is not missing.
If we include interaction terms between the new categorical variable and
all other variables, then essentially we're creating two separate models.
One for when there's missing data in this variable and one for when there isn't.
So it's really like a tree model with a single branch.
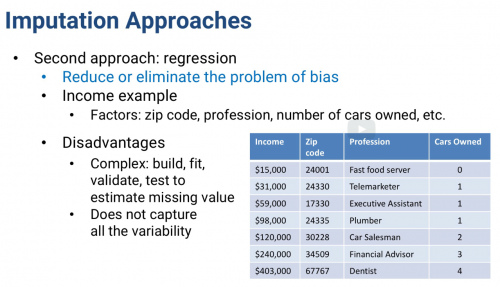
____________ is Estimating the missing values.
Imputation
One of simplest approaches to imputing missing data is to find the Mean or Median value of a factor. For categorical data, you find the ______
Mode.
Imputation Approaches: _______ Value
Mean, Median (Numeric) or
Mode (Categorical)
Advantage: Hedge against being too wrong
Easy to compute
Disadvantage: Biased imputation (Ex. People with high income less likely to answer survey) and Mean/Median will underestimate the missing value.
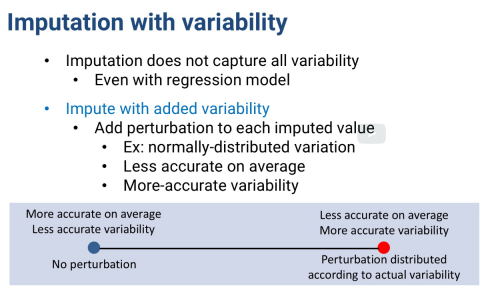
Midrange Value
A random amount up or down from each imputed estimate. Can draw from a normal distribution based on the error in the predictive model and change by that amount
Perturbation
True or False. Adding a perturbation will make the imputed value more accurate.
False. Adding random perturbations might make the imputed value less accurate. On average, probably better using the predictive model's estimated. Adding perturbations, gives a better estimate of the overall spread of the values.
True or False, Adding perturbations, will give a better estimate of the overall spread of the values.
True.
When imputing data, it's necessary to limit the amount of imputation. No more than ____ % of the data should be imputed and that's generally true for each factor.
5
And advanced methods like multivariate imputation by chained equations (MICE) can impute multiple factor values together.
Data used twice (overfitting)
Limit the amount of imputation - No more than 5% per factor
Imputation error + perturbation error + model error
(Yes, but regular data also probably has errors)
Data is always imperfect
-Errors
-Outliers
-Missing Data
Prescriptive Simulation can be very useful for asking, what if sorts of questions about systems. For example, how are the overall process throughput change if the company invested a $100,000 on a faster machine for one step of the process, or how valuable would hiring an extra call center worker be, or what's the right distribution of baggage tugs to have at the airport, one for each gate, one for every two gates or a floating pool at each half side of the concourse?
We can run the simulation with different options and compare the results to see what the best course of action is. Some simulation software even has the ability to do some heuristic optimization
of a set of parameters.
Comparing Simulations
How many tugs placed at each gate?
Simulation 1: One tug per gate
Simulation 2: One tug per 2 gates
Compare metrics between the simulations
(Fraction of bags that get to baggage claim in 20 minutes or less) Requires its owns statistical analysis (cont)
Basic test whether the means are different. Using same random numbers is like having a thousand different scenarios and for each scenario see which method is better and how often one is better than the other
Simulation Comparisons
Simulation can be powerful
-Model is only as good as quality of input
-Missing or incorrect information can lead to incorrect answers (cont)
Example. Assumption. Workers answer calls equally quickly.
-Actually lots of variability between workers
-Wrong assumption can lead to costly bad decisions
______ _______ are a fairly common and relatively simple way to statistically model random processes
Markov Chains
A _____ chain essentially consists of a set of transitions, which are determined by some probability distribution that satisfy the Markov property.
Markov
True or False. Markov chains are memoryless.
True. Markov chains are unable to successfully produce sequences in which some underlying trend would be expected to occur.
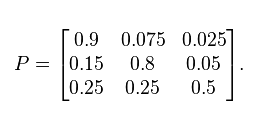
Formally, a Markov chain is a probabilistic automaton. The probability distribution of state transitions is typically represented as the Markov chain’s transition matrix. If the Markov chain has N possible states, the matrix will be an N x N matrix, such that entry (I, J) is the probability of transitioning from state I to state J. Additionally, the transition matrix must be a stochastic matrix, a matrix whose entries in each row must add up to exactly 1. This makes complete sense, since each row represents its own probability distribution.
Probability based analytics model that can be used for making comparisons. This model is based on states of a system.
Markov Chain
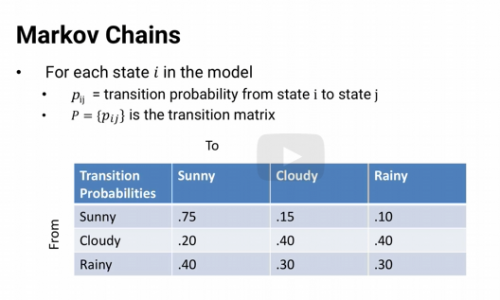
For each state i in the Markov chain model,
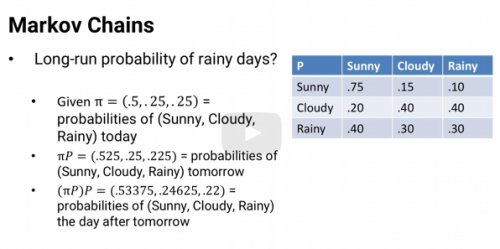
we know the probability that at the next step the system will be in state j. That probability pij is called the transition probability. For example P sunny-rainy is the probability that if it's sunny today, it'll be rainy tomorrow.
And for visualization we can put all of the transition probabilities pij into a transition matrix P.
Suppose we start out with a vector pi that shows the probability that the system is
in each state. So pi rainy is the probability that it's rainy today. If we multiply pi times p,
it gives us the vector of probabilities of being in each state tomorrow. Multiply again by P and we get the probabilities of it being in each state the day after tomorrow. And we could keep multiplying by P day after day.
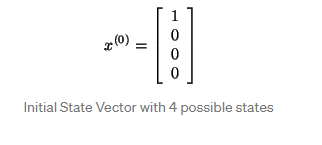
a Markov chain also has an initial state vector, represented as an N x 1 matrix (a vector), that describes the probability distribution of starting at each of the N possible states. Entry I of the vector describes the probability of the chain beginning at state I.
Steady state where the states have gotten so mixed that the initial conditions no longer matter.
In steady state, the probability of being in state i is the same every day.
So if we apply the transition matrix by multiplying pi by P,
we'll get our vector pi back again.
The probabilities are the same.
If we solve the system of equations pi times P = pi, and the sum of all the pi i equals 1, since they're probabilities, then we can find the steady state probability vector pi*.
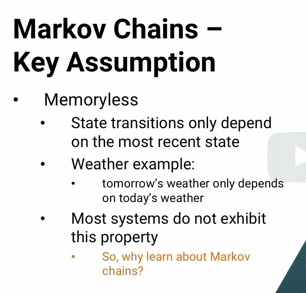
A key assumption of Markov chains is that they're _______.
It doesn't matter what the previous states were. The only thing that matters is what state we're in now.
Memoryless
Markov chains are useful when trying to connect smaller amounts of information to find larger ones.
Page Rank System
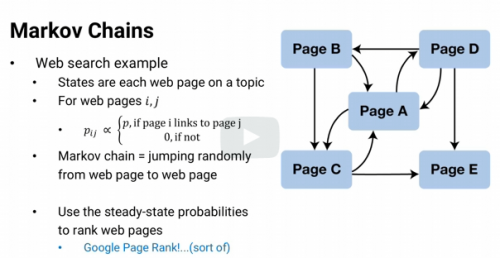
Using Markov Chains. How Google ranks webpages for its searches.
Which web page is the best one to learn about Markov Chains. We can list all of the Markov Chain webpages we can find and call them states. For each page, i, if it links to page j, we make that transition probability equal to some value p. Otherwise, we make the transition probability equal to 0. Most pages won't link to each other. So we'll have lots of 0's in the transition matrix. But now, we can use the transition matrix to see what
happens if we start at a Markov chain page and iteratively jump from one page to another using the available links.
Choosing a link at random and following it, choosing a link from that page and following it, etc. Only among Markov chain webpages. By finding the steady state probabilities, we'll discover which Markov web page we would be at, most often, second most often, etc, if we keep jumping around forever. And we could use that order as a ranking on the webpages.
Markov Chains to rank
-College basketball teams RMC ranking
-Urban sprawl
-Population dynamics
-Disease propagation
Markov Chains are used where the _________ property is important in the short run but not so important in the long run.
Memoryless
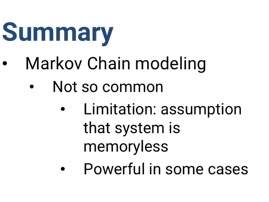
True or False. Markov Chains are not the most commonly used analytics methodology,
mostly because of the limitations of the assumption that the system is memory-less
True
Good for
Ranking College Teams
Web Page Ranking
Urban sprawl, Population Dynamics
Disease Propagation
The next state of a process doesn't depend on any of its previous state, but does depend on the current state.
In analytics, Memoryless
Answer Prescriptive Analytics questions
Underlie standard models in descriptive and predictive analytics
*Some can be solved quickly and others take a long time
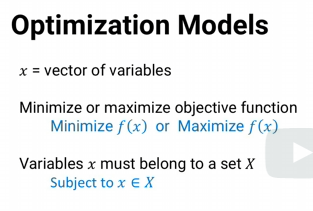
Optimization Models
Let x be the vector of variables.
Then the optimization model is to minimize or
maximize an objective function f of x, subject
to the constraint that the variables x have to belong to a set capital X.
Easy / Fast to Solve Mathematical Structure for Optimization Models is a ______
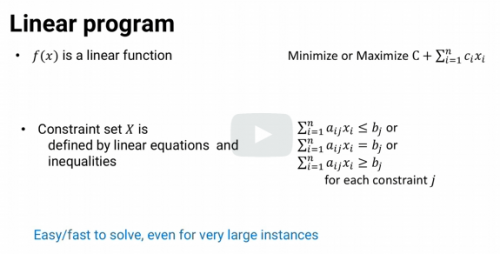
Linear Program
Suppose f(x) is a linear function, the sum of ci times xi plus a constant.
And suppose the constraint set X is defined by linear equations and
inequalities, the sum of aij time xi is less than or
equal to bj equal to bj or greater than or equal to bj for each constraint j.
This case is called the linear program, and it's easy and
fast to solve even large instances.
State of the art software can solve instances with more than
a million variables and constraints.
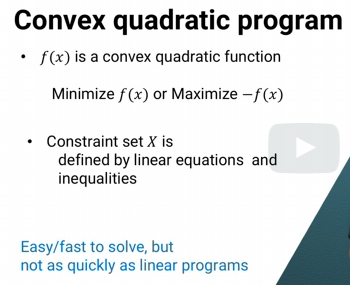
In optimization, mathematical structure which is easy/fast to solve but not as quickly to solve as linear programs
Convex Quadratic Program
If f(x) is a convex quadratic function and
the constraints are again linear, then its a convex quadratic program.
Convex quadratic programs are also quickly solvable,
though not as quickly as linear programs.
The object function f(x) is concave and
a maximization problem or convex in a minimization problem and
the constraints said x is a convex set.
convex optimization problem and
it's still mathematically an easy problem to solve, though it can a lot take longer to find optimal solution sometimes.
suppose we have a linear program but some or all of the variables are restricted to take only integer values.
This is called an integer program.
There are some very good software packages to solve integer programs.
But despite a lot of research in this area there is still even some pretty small
integer programs that state of the art software can't find optimal solutions to.
Even given days and days of computing time.
If the variables are binary variables, variables that have to be either 0 or
1, that's still true even though they're a more restricted type of integer variables.
And most generally,
if there is an optimization problem that's not a convex optimization problem then,
even very small problems can be very hard to find optimal solutions to
General Non-Convex Problems
In general, we can rank optimization problems from quickest and easiest to
slowest and hardest in this order, Linear Programs, Convex Quadratic Programs,
Convex Programs, Integer Programs, and General Non-Convex Programs.
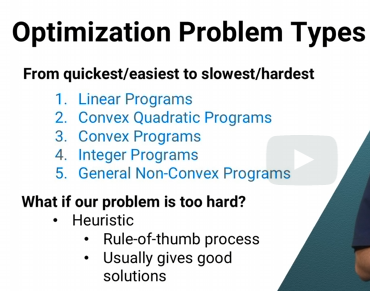
what do we do if a problem is too hard to find the optimal solution to?
we can use a heuristic, a rule-of-thumb process that usually gives good solutions
even if it's not guaranteed to find the optimal solution.
Type of optimization model can be solved very quickly, even more quickly than linear programs.
Network optimization problem.
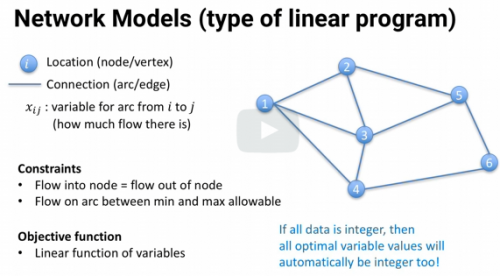
Name 3 types of common network models
1) Shortest Path Model
2) Assignment Model
3) Maximum Flow Model
Finds quickest / shortest route from one place to another
Example: Google Maps, GPS
Shortest Path Model
Which worker gets which job to maximize workforce efficiency?
Assignment Model
How much oil can flow through complex network of pipes?
Maximum Flow Model
True or False. Requiring some variables in a linear program to take integer values can make it take a lot longer to solve.
True. Adding integer variables moves the model from a linear program, which usually solves very quickly, to an integer program, which sometimes takes a long time to solve.
What if data or parameters isn't known exactly?
What if forecast values aren't known exactly?
other times it's important to model the uncertainty and
randomness in an optimization framework.
Because considering a single outcome won't give good suggested decisions for many of the possible range of outcomes. This is __________ optimization
Stochastic Optimization
Stochastic Optimization: Approach 1) Model Conservatively. In the Constraint we could add an additional amount theta just in case. The solution might have a few extra workers now on most days, but less likely to have fewer workers on high demand days.
Alternatively, if we have a good estimate of the probability distribution for demand, we can even write a chance constraint the probability of having enough workers to meet demand must be at least some value p.
In either case we'd have to pick the value of theta or
p that makes the most sense for the problem we're modeling.
Stochastic Optimization
What if data or parameter isn't known exactly?
What if forecast values aren't known exactly?
Approach 2) Define some, even many, scenarios and optimize over all of them. This is called _________.
Scenario Modeling.
Stochastic Optimization.
What if data or parameter isn't known exactly?
What if forecast values aren't known exactly?
Once we have all of the scenarios defined, we could choose to force the model to pick a solution that satisfies every scenarios constraint. This is sometimes called the _______ solution.
Robust.
Satisfying every possible scenarios demand might be expensive.
since we have lots of scenarios we then need to
estimate the probability of each scenario occurring And weigh the missed demand costs by each scenario's probability in the objective function. Either way we deal with scenarios, the difficulty is that there might be lots of them. And for each scenario we have a separate set of constraints. That means the optimization model could get very large very quickly. And it could get hard enough to solve that we need to use ______ to find a solution that's hopefully a good one, even if it's not the absolute optimal solution.
heuristics
3 Mathematical Programming Models with Different Optimization Structures are:
* Dynamic Program
* Stochastic dynamic Program
* Markov decision process
*States (Exact situations and values)
*Decisions (choices of next state)
*Bellman's equation: determine optimal decisions
Dynamic Program
Dynamic Program, but decisions have probabilities of next state
Stochastic Dynamic Program
*Stochastic dynamic program with discrete states and decisions
*Probabilities depend only on current state/decision
Markov Decision Process
In a Dynamic program, use ________ equation to make the optimal decision to make at every state.
Bellman's equation
In this model, it assumes there's no uncertainty. Given in a state and a decision we know exactly what the next state will be
Dynamic Programming Model
Sometimes there's uncertainty involved. We make a decision without knowing exactly what the next state will be. As long as we know the probabilities of going from one state to another, we can modify the dynamic programming model with the probabilities incorporated.
Stochastic dynamic program.
We have a discrete set of states and decisions, and
the probabilities only depend on the current state and decision.
Markov decision process.
What two types of models are used for optimization under uncertainty?
*Mathematical Programming
*Dynamic Programming
The main point is that there are lots of ways to deal with uncertainty and optimization problems. Some based on mathematical programming models and
some based on other models like dynamic programming.
Either way they provide approaches for optimizing under uncertainty to make good prescriptive analytics recommendations even when it makes a difference that our data and our forecasted values are not exactly known
True or False. Optimization Models implicitly assume we know all of the values of the input data exactly.
True. Optimization models treat all of the data as known exactly.
How to Solve an Optimization Model
1) Create a First Solution
*Can be simple/bad/infeasible
2) Repeat
*Find improving direction t
*Use step size theta to move it along
*New solution = old solution + theta(t)
3) Stop when solution doesn't change much or time runs out
Most optimization algorithms have two main steps:
1) _________ somehow create a first solution to pick values for all of the variables (Could be bad and not satisfy all the constraints)
2) _______
*Find improving direction t
*Using a step size theta to move along it
*New solution = old solution + theta(t)
Stop when solution doesn't change much or time runs out
Initialization
Repeat
Starting with the current solution - find a vector of relative changes to make to each variable. This vector is called an
Improving Direction
Making changes to the improving direction by some amount is called the _____ _________.
Step size.
The vector t is the relative change in each variable, and
theta is the amount that we change. The new solution is just the old solution, plus the improving direction times the step size. And then we iterate, we keep repeating this process of finding an improving direction, finding a step size, and getting a new solution until either the solution doesn't change much or we run out of time.
Solving an optimization model
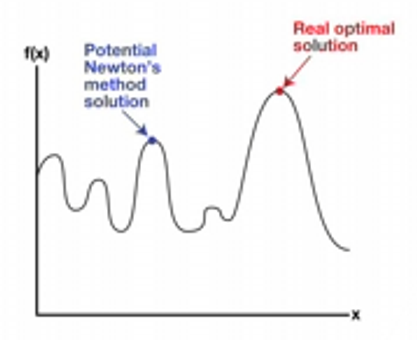
Algorithm for finding roots of a function - At each step n, we have a current solution xn, we find an improving direction, -f(xn) divided by f prime xn where f prime is the derivative of f. And then we move one unit in that direction. So out new solution xn + 1 is xn plus 1 times the improving direction.
Newton's Method
Type of optimization problem guaranteed to find the optimal solution.
Convex Optimization Problem
Non-Convex optimization problem
* Not guaranteed to find optimal solution
-Converge to infeasible solution
-Converge to local optimum
Convex Optimization Problem

These types of tests are used when the underlying distribution of the data is unknown.
Nonparametric statistical tests
Non-Parametric Method
Used for comparing results on pairs of responses. Is the data points where two different approaches are used on the same thing. Ex. Two competing treatments for a virus. Which one is better?
McNemar's Test
Non-Parametric Method.
Don't need to know anything about the distribution of data. It is a comparison on pairs of results. Throws out cases where results are the same and tests using binomial distribution.
McNemar's Test.
Non-Parametric Method. Only consider where A and B are different. Tests using the binomial distribution to see whether we'd expect results or is it just luck?
McNemar's Binomial Test
*In the first scenario, the p-value is about 0.02.
There's only about a 2% chance we'd see these results by luck. In the second scenario, the p-value is about 38%. There's a pretty good chance it's just luck.
Non-Parametric Method.
No assumptions on response
Only Assumptions are: Distribution is continuous and symmetric
Question: Is the median of the distribution different from m?
Wilcoxon Signed Rank Test for Medians
Non-Parametric method.
Is the median of the distribution different from a specific value m?
Wilcoxon Signed Rank Test
Non-Parametric Method: Wilcoxon Signed Rank Test
Given a set of responses, y1 through yn, we find the absolute value of each yi- m. And we rank the absolute values from smallest to largest. Then we add up the ranks, only of the ones where yi is greater than m.
Let's call that sum W. The test is a standard p-value approach. If the probability p of getting a sum of ranks at least as extreme as W is small, then we can say that the median is probably different from m.
_______ uses binomial distribution to calculate p-values. Test is designed for when the observations are just yes or no.
________ is like a normal distribution test for when observations are numeric data
McNemar Test
Wilcoxon Test
Non-Parametric Method.
Comparing two samples where the outcomes are not paired. Assume all observations are independent of each other.
Mann-Whitney Test
Non-Parametric Method
Given Independent Observations. In the _________ test we rank all of the yi and zi together.
And then, add up the ranks of all the samples that come from the first set. All the ranks of the yi and
the ranks of the samples in the second set, all the ranks of the zi. Whichever sum is smaller is compared again against the table that gives the significance of the difference.
Mann-Whitney Test
Non-Parametric Tests are used when nothing is known about underlying distribution.
When there are two data sets:
1) McNemar's Test (paired yes/no)
2) Wilcoxon Signed Rank Test (Paired numeric data)
3) Mann-Whitney (Unpaired data)
When One data set
Wilcoxon Signed Rank Test (Comparing possible Median)
The basic idea is that even when we don't know anything about the underlying processes that create the observations, we can still use the relative ranks or
outcomes of two competing approaches to see whether the difference between them is significant.
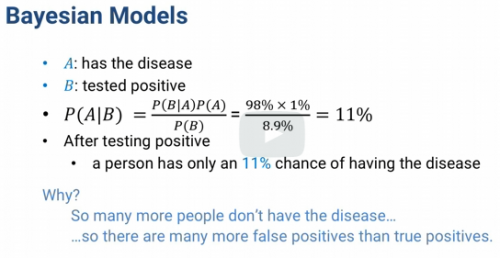
Bayesian Modeling. Based on a basic rule of conditional probability called ______ rule or _____ theorem.
The probability of A given B Is the probability of B given A times the probability of A divided by the probability of B.
Bayes.
We're looking for the probability someone has the disease, which we call A. Given that he tested positive, which we can call B. That's equal to the probability of testing positive or B, given that he has the disease or A times the probability of having the disease divided the probability of testing positive. So, that's 98% times 1% divided by 0.89% or only about 11%. Even after testing positive, a person only has an 11% chance of having the disease. Because there are so many people who don't have it that the number of false positives is about eight times higher than the number of true positives.
That's a little counterintuitive.
Almost 90% of positive tests don't have the disease, but
it's not so hard to explain. But that's just a simple application of Bayes's theorem, the sort of thing you might remember from basic probability.
Use this model when the overall distribution of something is known or estimated but only a little bit of data is available.
Empirical Bayes Modeling
Based on the outcome of regular season games,
we wanna try to estimate how much better one team is than another. From past NCAA point spread data,
we can estimate that the difference in points scored by the home team and road team is approximately normally distributed with variant sigma squared.
And mean equal to the home court advantage h plus m,
the true difference in the team strength. Of course, we don't know m.
We look for the probability of having true difference m given the observation x. By Bayes rule, the probability of m given x is the probability of observing a point difference of x given a true margin m times the probability that the true margin is m divided by the probability that the observed margin is x.
Bayesian Approach, especially in the absence of a lot of data...Even a single observation combined with broader set of observations one can make a deduction or prediction.
Type of model that works very well in the absence of lots of data.
Bayesian approach
Bayesian Modeling
Initial distribution assumed for P(A) is called the
Prior Distribution
Bayesian Modeling
The revised distribution P(A|B) is called the
posterior distribution
Expert opinion can be used to define the initial distribution of P(A) and observed data abut B can be used with Bayes theorem to obtain a revised opinion P (A|B)
How Bayesian models incorporate expert opinion when there's not as much data to analyze
Type of Model that answers important questions in the analysis of large interconnected populations
Communities in Graphs
How marketing messages propagate through social media networks
Communities in Graphs
How disease outbreaks spread through populations or
Computer viruses spread through a network
Communities in Graphs
How words have spread from language to language over time or
How terrorist networks communicate
Communities in Graphs
Communities in Graphs - Automated ways of finding highly interconnected subpopulations. Within subpopulations, things can spread much more quickly.
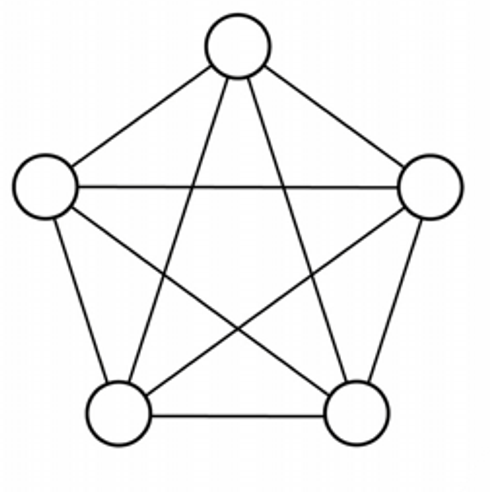
Communities in Graphs:
Community - a set of circles that's highly connected within itself
Graph - circles = nodes / vertices
lines = arcs / edges
Clique = set of nodes that all have edges between each other
Louvain Algorithm: decomposing a graph into communities.
We don't necessarily need full cliques. Communities with lots of edges between the nodes are valuable to find. The method for decomposing a graph into communities is called the
Louvain Algorithm
Maximize the Modularity of a graph
aij: weight on the arc between nodes i and j
wi: total weight of arcs connected to i
W: total weight of all the arcs
Modularity : 1 / 2W times the sum over all pairs i and
j of nodes in the same community of (aij minus wi times wj over 2W.
Louvain Algorithm tries to maximize a measure called the modularity of a graph and we'll need a little notation to talk about it.
Measure of how well the graph is separated into communities or modules that are connected a lot internally but not connected much between each other.
Modularity of a graph
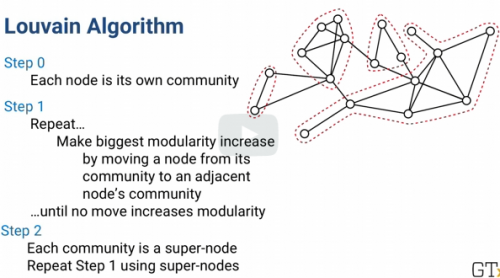
Louvain Algorithm
Step 0: Each node is its own community
Step 1: Repeat...Make biggest modularity increase by moving a node from its community to an adjacent node's community...until no move increases modularity
The Louvain algorithm has just a few mostly repeated steps. It starts with each node being its own community.
Then for each node, i, it looks to see
if it moves i into another community how much does the modularity go up? Whichever move creates the biggest modularity increase that's where node i goes. If nothing increases modularity, node i just stays where it is.
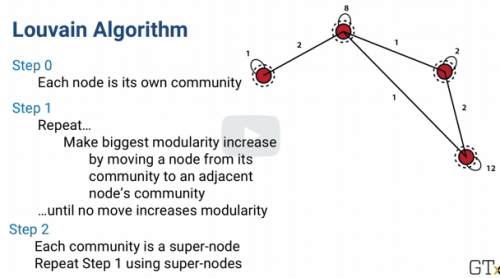
Louvain Algorithm
There is also a super-arc for each super-node to itself
with weight equal to the weight of all arcs inside the super-node. The algorithm then starts again at the beginning using the super-nodes and super-arcs.
The Louvain algorithm is a heuristic, meaning its not guaranteed to find the absolute best partition of a graph into communities, it often gives very good solutions very quickly.
Which Heuristic is often used to find communities inside a large network, especially social media networks, and networks of people, computers, etc.
Louvain algorithm
Suppose we have a graph where all edge weights are equal to 1. Want to split the nodes into large groups that have very few connections between them (sets of people with very different sets of friends)
Change the graph. For every pair of nodes i and j, if there is an edge between i and j then remove it. and if there's not an edge between i and j, then add it. Run the Louvain algorithm on the new graph. This will find highly interconnected communities
A set of nodes with edges between each pair is called a clique and a set of nodes without any edges between them is called an
Independent Set
Two analytic models often used when we need to react to patterns that we don't understand. (Think of CAPTCHA) So many rules and exceptions that we can't specify rules or algorithms.
Neural Networks and Deep Learning
In artificial Neural Networks, there are three levels of simulated neurons:
Input Level
Hidden Level
Output Level
In the end,
the models predicted output is which ever output there on has the highest result. A simple one is basic gradient descent using the slope of a function
like you might remember from Calculus.
If the network learns well, with enough data eventually all of the weights will be adjusted so that the network generates correct outputs from the input.
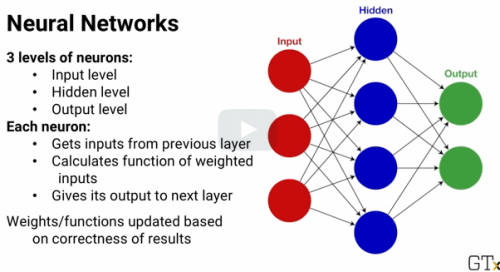
In practice, neural networks often don't give the best results. They require lots of data to train and it's often hard to choose and tune the learning algorithm so the weights don't change too slowly but also don't change so quickly that they jump all over the place. But because neural networks have a catchy, biologically inspired name, I think they get more buzz than they might deserve so they're good to know about.
True or False. Neural networks are much more successful than Deep Learning.
False. Deep Learning is much more successful.
Deep learning is very similar to neural networks in it's leveled structure, but as the name deep implies, it might have a lot of layers.There are lots of variations of deep learning, but the basic idea of all of them is about the same, and not much different from neural networks.
Deep learning is a pretty good success in analytics in the areas of natural language processing, speech recognition and image recognition. It's currently a pretty hot research topic and because it's often used for processing text and language, it's covered in our elective course on those topics.
Deep Learning is currently one of the best approaches for recognizing images, speech, writing and language
Us-Against the Data
Descriptive Models - Get an understanding of reality
Predictive Models - Find hidden relationships and Predict the future
Prescriptive Models - Find the best thing to do
**Assumes system does not react.
What if the system reacts intelligently. Use analytics to consider all sides of the system
Competitive Models. Considering all sides of the system
Game Theory
*Competitive decision making
Cooperative game theory (Competition + cooperation)
Game Theory Timing:
Make decisions Simultaneously (Can't change once made. ex. Sealed bid auction)
Strategy
*counter strategy
*counter counter strategy
*counter counter counter strategy
Sequential Game
*Decision made sequentially
Sometimes, everyone has to make decisions simultaneously, and can't change once they're made.
So you have to think about what strategy you competitors might use and come up with your best counter-strategy.
Of course, they're thinking about what counter-strategy you might use and coming up with their counter-counter strategy. So you need to consider that and devise your counter-counter-counter strategy and so on. If you do that infinitely many times you'll reach your best solution and that's essentially what game theory is all about.
The same general idea is also true even if decisions are made sequentially. Sometimes you can see the other side's strategy before making your decision or vice versa.
That's called a sequential game.
Types of Game Theory Strategies:
Pure Strategy Just one choice
Mixed Strategy Randomize decisions according to probabilities
*Rock-paper-scissors
In this case pure strategy will lose and mixed strategy is best bet
Game Theory Information Levels
Perfect Information Know all about everyone else's situation (Ex. playing chess)
Imperfect Information Some have more information than others (Not symmetric) (Ex. Real life gas station case)
Game Theory
Zero-Sum Whatever one side gets, the other side loses (Ex. Rock-paper-scissors.)
*Overall outcome is 1 win + 1 loss
Non-Zero Games Total benefit might be higher or lower. (Example: Economics)
On the other hand, in a non-zero-sum game, it's possible for the total benefit for everyone to be higher or lower depending on the decisions made. Economics is often like this. It's possible for everyone in an economy to effectively become richer or poorer, rather than just having a fixed amount of richness.
Game Theory. How to determine the best strategy for competitive decision making (Game Theory)?
Optimization Models
It turns out that in most cases different optimization models can be used, and that's not such a surprise since we're thinking in terms of finding the best, or optimal strategy.
A company wants to optimize its production levels based on production cost, price, and demand. The company already has estimated a function to give predicted selling price and demand as a function of the number of units produced, and the number of units its competitor produces.
Situation where competitive decision making (game theory model) is appropriate
_________ is a system property which measures the degree to which densely connected compartments within a system can be decoupled into separate communities or clusters which interact more among themselves rather than other communities.
Modularity
Optimization in Statistics
Linear Regression Statistics vs Optimization.
In Statistical Model: The intercept and coefficients are constant and the data are variable.
In Optimization Model: The coefficients are the variables and the data are constants
Terminology of Regression
Statistics:
xij are variables
aj are constant coefficients
Optimization Point of View:
xij are constant coefficients
aj are variables
Other Regression Models:
Linear Regression: No constraints
Lasso Regression Constraint: Abs sum Coeff <= T
Ridge Regression Constraint: Sum Squares <= T
Elastic Net Constraint: Combines the two terms into one constraint
Optimization in Logistic Regression:
The optimization variables are the regression coefficients and there are not constraints. The objective function is to minimize the prediction error.
Optimization for SVM Support Vector Machines
Hard Classification: Variables are the coefficients and the constraints are each data point is correctly classified. Objective function is to minimize the distance or margin between the support vectors.
In soft classification: the variables are the coefficients a0 and a1 through am. There are no constraints. The objective function absorbs the margin and classification errors
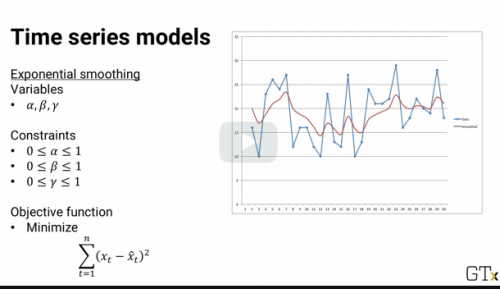
Here's an exponential smoothing model, where we want to fit the values of alpha, beta, and gamma for forecasting. And here's the optimization model to do the fitting. The variables are alpha, beta, and gamma.
The constraints are that all three variables need to between 0 and 1. And the objective function is to minimize the prediction error.
Optimize Time Series Models: ARIMA and GARCH
The variables are mu, thetas, and pi's
There are no constraints
Objective Function is to minimize the error
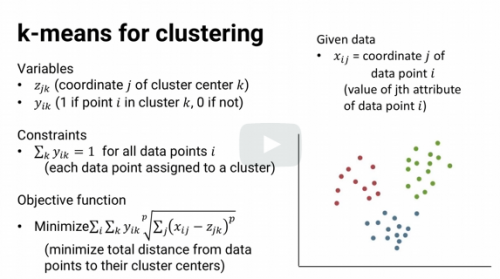
The variables are the coordinates for the cluster centers, and binary variables for whether each data point is part of each cluster. The constraints require each data point to be assigned to exactly one cluster. And the objective function is to minimize the sum of distances from each data point to its cluster center.
Statistical Models with underlying optimization models:
Linear Regression
Logistic Regression
Lasso Regression
Exponential smoothing
k-means clustering
*Even methods like maximum likelihood estimation
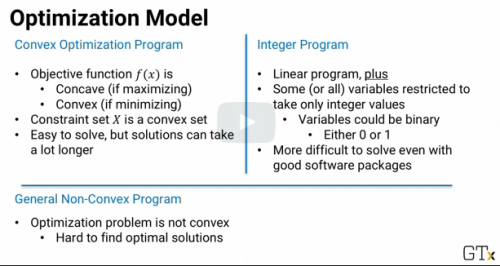
Convex Optimization Program
Objective Function: f(x) is
-Concave (if maximizing)
-Convex (if minimizing)
Constraint set X is a convex set
Mathematically Easy to solve but solutions can take a lot longer to find optimal solution.
Integer Program
- Linear plus some or all variables restricted to take only integer values (Variables could be binary)
-More difficult to solve even with good software
General Non-Convex Program
-Optimization problem is not convex
-Hard to find optimal solutions
Scenario Modeling. Define some even many scenarios and optimize over all of them. Once we have all of the scenarios, we could choose to force the model to pick
a solution that's satisfies every scenarios constraint. This is sometimes call the
Robust Solution
Other models with different optimization structures than Mathematical:
Dynamic program
Stochastic dynamic program
Markov decision process
Starting with the current solution, find a vector of relative changes to make each variable. That vector is often called an improving direction. And then make changes in that improving direction some amount, and that amount is called the step size. In this equation, the vector t is the relative change in each variable, and theta is the amount that we change. The new solution is just the old solution,
plus the improving direction times the step size. And then we iterate, we keep repeating this process of finding an improving direction, finding a step size, and getting a new solution until either the solution doesn't change much or we run out of time.
Newtons method: finding root of f(x)
Current solution xn at step n
Nonparametric tests are sometimes called distribution-free tests because they are based on fewer assumptions (e.g., they do not assume that the outcome is approximately normally distributed).
R^2 is the proportion of variance explained. Number between 0 and 1. When the values is near 0, means the regression did or did not explain the variability? Do we want a high or low r^2 value?
Did not. The linear model might be wrong or the inherent error sigma^2 is high or both.
High! Measure of fit.